
Without a relevant comparison point, a score is just a score. Was last year's result higher or lower? How does it compare to similar treatment providers? Does it predict who walks out the door in six months?
Gallup's 2026 report found that only 31% of U.S. employees were engaged in 2025, which shows how low the national bar sits even before you factor in behavioral health's unique staffing pressures.
This guide covers which benchmarks to track, how to source reliable U.S. comparison data, how to avoid misleading conclusions from mismatched scores, and how behavioral health leaders can connect engagement data to staff stability and care quality.
Key Takeaways
- No engagement score is universal; survey design and peer context matter more than the raw number
- Combine historical, internal, external, demographic, leadership, and workforce-outcome benchmarks, not one metric
- Treat benchmark gaps as investigation prompts, then pair them with driver analysis and employee comments
- Connect engagement scores to retention, burnout risk, onboarding success, and continuity of care
What Are Employee Engagement Benchmarks?
An employee engagement benchmark is a reference point used to interpret survey results, not the result itself. It tells you whether a 68% favorable score is strong, average, or concerning for your type of organization.
Benchmarks vs. Metrics and Scores
Engagement metrics are what you measure: a percent-favorable score, a mean, an eNPS result. Benchmarks are what you compare those metrics against. The two get confused constantly.
- Engagement metric: your organization's raw score on a specific survey item
- Engagement benchmark: industry, historical, or internal data used to interpret that score
- Satisfaction score: a separate measure of job contentment, not interchangeable with engagement
- HR benchmark: a broader category covering recruiting, learning, and turnover data, of which engagement is one piece
The same raw score can mean different things depending on question wording, response scale, population surveyed, and benchmark source. A 70% favorable score on a 5-point scale isn't automatically comparable to 70% on a 7-point scale, or to a different vendor's "percent engaged" classification.
Benchmark vs. Goal
A benchmark provides context. A goal defines the improvement you intend to pursue. If your organization scores 55% favorable on manager trust and the relevant peer benchmark sits at 62%, that gap is your starting point, not your finish line.
A reasonable goal might be closing half that gap over two survey cycles while tracking retention alongside it.
Use Benchmarks to Investigate, Not to Pressure Employees
Comparison data should prompt questions, not scorekeeping contests between departments. Leaders who chase a number rather than fix the underlying experience tend to see survey fatigue and guarded responses. Treat a below-benchmark score as a prompt to look at workload, communication, or onboarding, not a performance target handed down to staff.
Types of Employee Engagement Benchmarks
HR researchers and vendors classify these differently, but the following categories cover what matters most for behavioral health organizations.
Historical Benchmarks
Compare current results against your own organization's previous survey cycles. This is often the most reliable comparison available because the population and survey design stay consistent. Track whether:
- Scores show sustained improvement or decline across three or more cycles
- Seasonal patterns exist, such as dips during high-census periods
- A specific intervention, like a new onboarding program, produced a measurable shift
Internal Benchmarks
Compare departments, locations, shifts, or tenure groups within your own organization. This surfaces disparities a single aggregate score hides.
Protect anonymity by avoiding small-group reporting, and avoid comparing materially different roles, like residential direct-care staff against administrative staff, without noting the different nature of the work. Platforms built for behavioral health, such as Care Predictor's Reporting & Analytics dashboard, let leaders filter by location, level of care, and department while keeping individual responses protected.
External and Industry Benchmarks
This is where organizations most often go wrong, grabbing a generic cross-industry number instead of a relevant one. Healthcare-specific data tells a different story than Gallup's national figure.
Press Ganey's 2026 report found healthcare engagement scores rose from 3.97 in 2025 to 4.03 in 2026, drawn from feedback across more than 2.6 million healthcare workers. Neither Gallup nor Press Ganey is behavioral-health specific, and the two use entirely different scoring methods, so match scale and population before drawing conclusions.
Demographic and Lifecycle Benchmarks
Segment results by tenure, role, manager, and employment type to catch disparities across onboarding, workload, belonging, or advancement. A new hire's first 90 days often tell a very different story than a five-year veteran's experience, and averaging the two together hides both.
Leadership, Team, and Purpose Benchmarks
Trust in managers, psychological safety, teamwork, and connection to mission often drive engagement more than any single overall score. These are the levers leaders can actually pull, which makes them worth tracking on their own rather than folding into one aggregate number.
Workforce-Outcome Benchmarks
Connect survey findings to voluntary turnover, absenteeism, time-to-fill, and onboarding completion. Define each measure before comparing:
- Voluntary turnover: employee-initiated separations as a share of average headcount
- Absenteeism: unplanned absence rate among full-time staff
- Time-to-fill: average days needed to fill an open position
- Onboarding completion: share of new hires who finish required onboarding within the defined window
NSI's 2026 report found total hospital turnover reached 18.5% in 2025, with voluntary separations making up nearly 95% of exits, though that figure reflects acute-care hospitals, not behavioral health specifically.
Internal data across Care Predictor's behavioral health clients tells a different story, with annual turnover commonly running 30% to over 40%. That gap is exactly why borrowing a hospital-wide number can understate what residential and substance use treatment programs actually face.

The Employee Engagement Metrics to Track in 2026
Engagement Index and Favorable-Response Scores
Pick a consistent set of validated survey items and keep the wording identical across cycles. Changing one word in a question can shift results enough to look like a real trend when it's actually a measurement artifact. Document your scoring method, whether mean, percent favorable, or percentile, and always report response rate alongside the result.
Employee Net Promoter Score (eNPS)
eNPS asks one question: how likely employees are to recommend your organization as a place to work. Scores range from -100 to +100.
Care Predictor's engagement dashboard illustrates this in practice. A client organization can see its score and break it into promoters, passives, and detractors. Results can be segmented by team, manager, or location to find where advocacy is strongest and weakest.
A single-question score can't diagnose why employees feel a certain way, so treat it as a pulse check, not the full picture.
Leadership and Manager Effectiveness
Trust, communication, recognition, coaching, and workload management under a specific manager often predict engagement better than company-wide averages. Compare results by manager or team only where sample sizes are large enough to protect confidentiality.
Belonging, Purpose, Growth, and Well-Being
Clinical, direct-care, administrative, and support staff often experience these differently. A therapist's sense of purpose may hinge on caseload and supervision quality; a support-staff employee's may hinge on recognition and advancement. Track:
- Connection to mission
- Career development opportunities
- Psychological safety
- Workload sustainability
- Access to support resources
Retention and Staffing Indicators
Pair engagement results with turnover, tenure, absenteeism, and onboarding completion to test whether survey concerns show up in actual workforce outcomes. If engagement scores look flat but turnover keeps climbing, the survey may be missing what the exit interviews are catching.

Behavioral Health Outcome Connections
Staff stability and care quality appear connected, but the evidence supports correlation, not proven causation. A healthcare research review examining staff engagement and patient safety outcomes found only a modest statistical association, not a guaranteed cause-and-effect link. Treat outcome connections as a hypothesis worth testing against your own data, not an assumption to build a strategy on.
How to Build and Use an Employee Engagement Benchmarking Program
Building a benchmarking program that actually drives decisions takes more than scheduling an annual survey. Follow these six steps:
- Define the decision. Identify whether you're investigating retention, burnout, leadership effectiveness, or onboarding, then select only the measures that inform that specific decision.
- Choose your comparison groups. Combine historical, internal, and external benchmarks. Match external data by industry, organization size, role mix, geography, and survey methodology.
- Standardize data collection. Use consistent core questions and scales across cycles, adding a limited number of organization-specific items. Include annual, pulse, onboarding, stay, and exit feedback where it fits.
- Protect data quality and trust. Communicate why you're surveying, explain anonymity and reporting thresholds, and avoid exposing small groups through overly granular reporting.
- Interpret the results. Review trends over time, segment by relevant groups, analyze open-text themes, and look for drivers that are both statistically and operationally meaningful.
- Turn findings into action. Pick a small number of priorities, assign an accountable leader to each, define the specific behavior that should change, and set a review date.
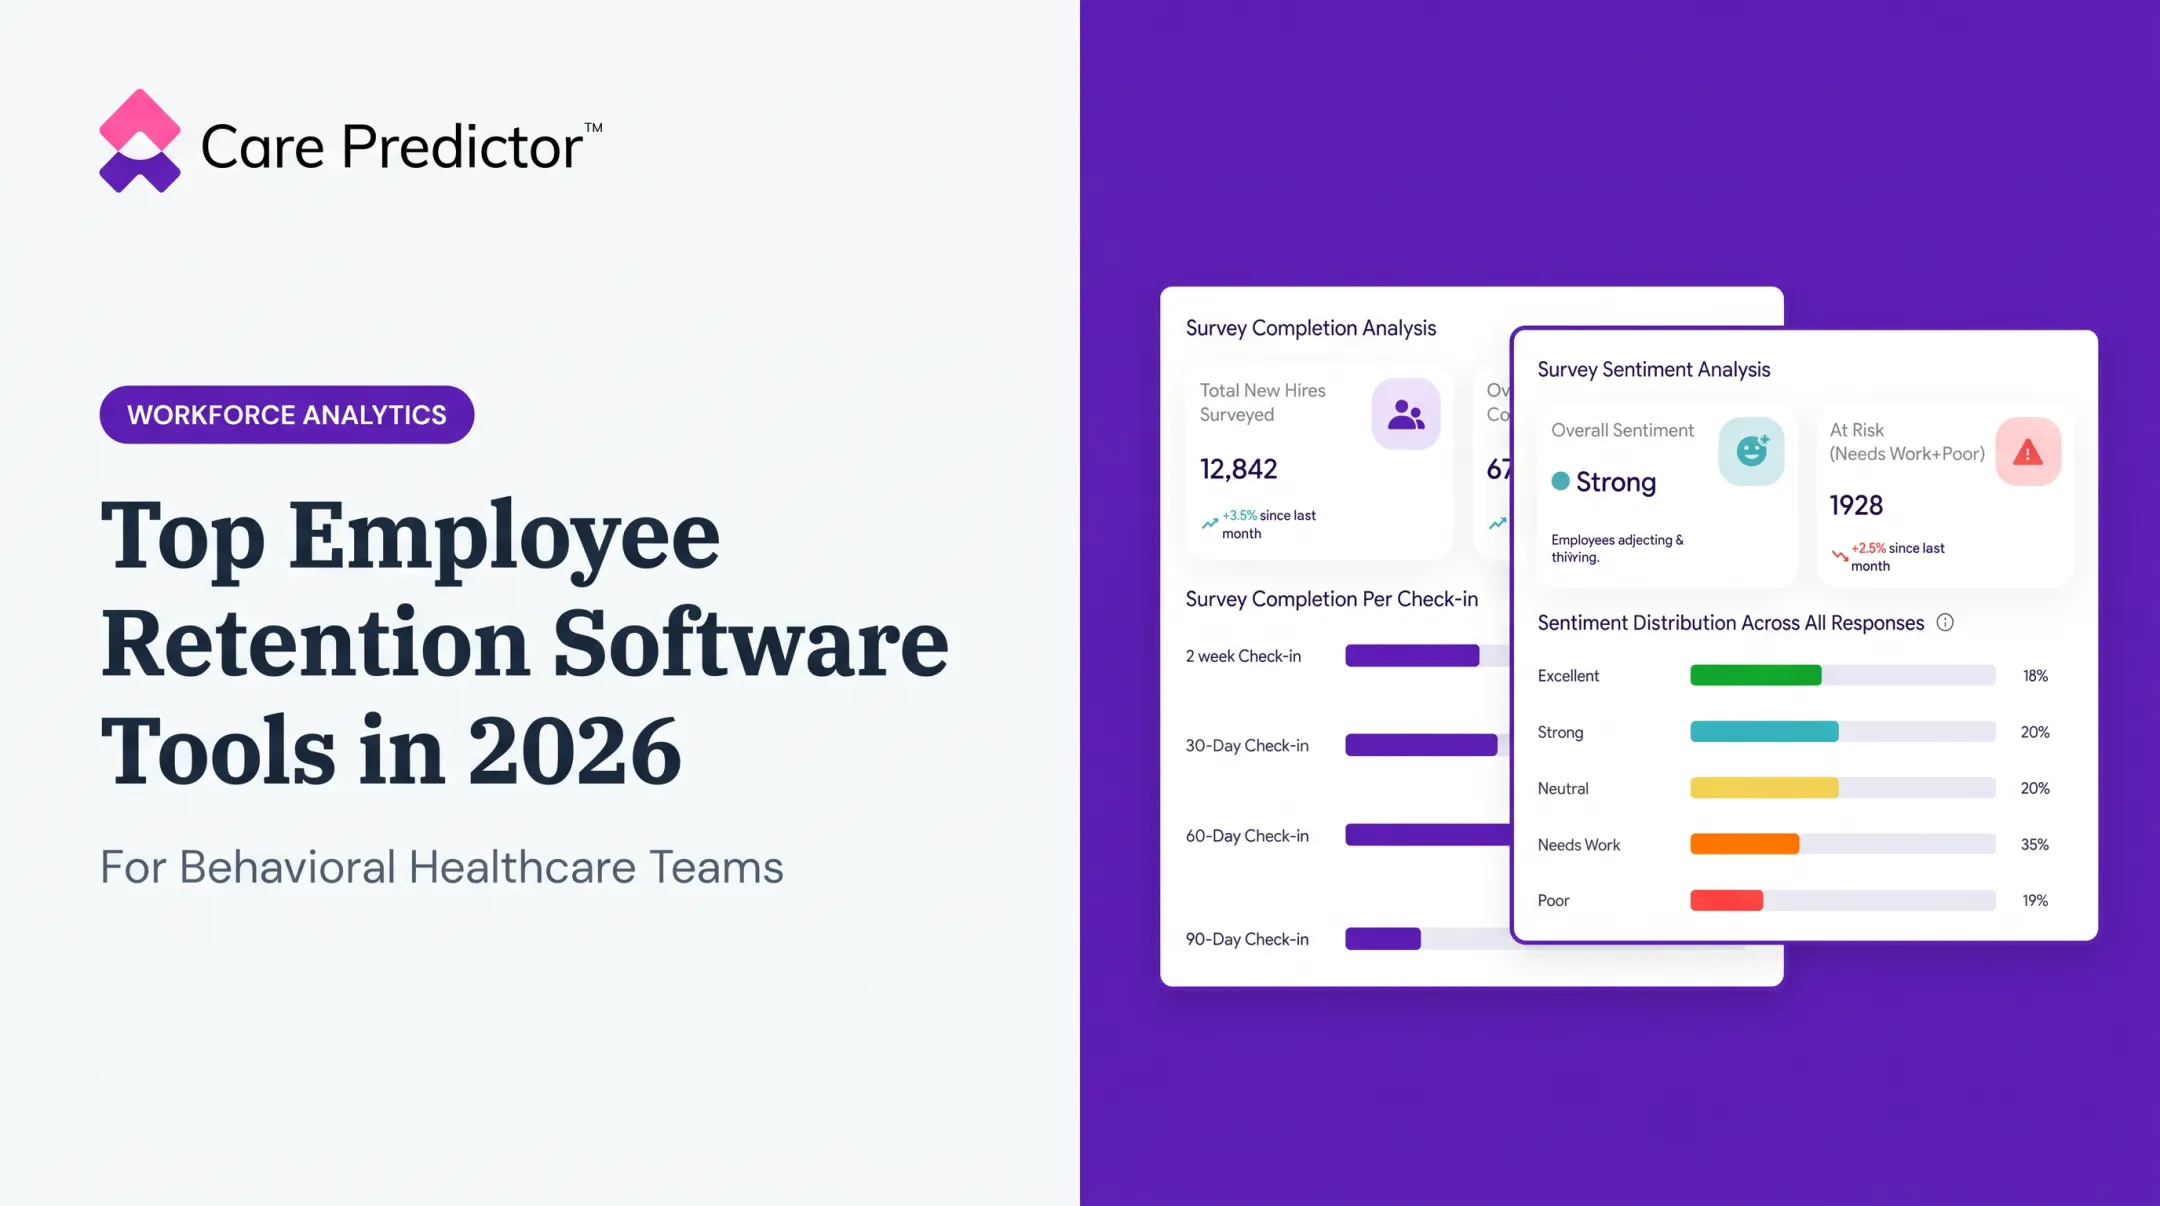
Behavioral health organizations juggling all six steps often need more than a basic survey tool. Care Predictor's Employee Feedback & Engagement Survey Platform automates onboarding pulse checks at the 2-week, 30-, 60-, and 90-day marks, tracks eNPS by team or location, and uses AI to flag sentiment trends in open-ended responses.
It supports behavioral-science-backed work across candidate assessment, onboarding, and engagement decisions. No platform replaces an attentive manager's judgment or the value of reading what employees write.
Why Behavioral Health Organizations Need Their Own Engagement Context
National, cross-industry averages can obscure what's really happening on a psychiatric unit or inside a residential substance use program. Emotionally demanding care, shift-based scheduling, clinical supervision requirements, and chronic staffing shortages all shape engagement differently than they do in a typical office environment.
A more useful peer group accounts for:
- Organization size and number of locations
- Service model (residential, outpatient, detox, partial hospitalization)
- Role mix across clinical, direct-care, and administrative staff
- Employee tenure patterns
- Current U.S. labor-market conditions for behavioral health roles
This matters most for multi-location providers with 150 or more employees. One aggregate score can bury real differences between a stable outpatient clinic and a residential program cycling through staff every few months.
Early research suggests staff stability and care quality are connected. Care Predictor's own analysis across five behavioral health organizations, spanning detox, crisis stabilization, residential, and outpatient services, found that therapists with higher Care Predictor Index scores saw higher treatment completion rates and fewer discharges against medical advice.
That's a correlation worth investigating in your own data, not a guarantee that raising one score fixes the other.

Behavioral health is relationship-driven work. Care Predictor builds its platform on that premise, using behavioral science and analytics to strengthen hiring and workforce decisions while the work of connecting with patients and staff stays with the people doing it.
Frequently Asked Questions
What are examples of employee benchmarks?
Common examples include engagement index scores, voluntary turnover, absenteeism, manager effectiveness ratings, eNPS, response rates, time-to-fill, and onboarding completion. Which ones matter most depends on your organization's goals and comparison group.
What are benchmarks in HR?
HR benchmarks are reference points used to compare people metrics or practices against historical results, internal groups, peer organizations, or external industry data. They cover far more than engagement, including recruiting and learning and development.
What are the 7 types of benchmarking?
This guide groups them as historical, internal, external, industry, demographic/lifecycle, functional or process, and workforce-outcome benchmarking. Terminology varies by source, and some vendors combine or split these categories differently.
How often should we update engagement benchmarks?
Review historical and internal benchmarks every survey cycle, typically annually with pulse checks in between. Refresh external benchmarks whenever your data source releases updated figures, usually once or twice a year.
What's a reasonable eNPS for a behavioral health organization?
There's no universal target. Track your own score over time, segment it by team or location, and compare it against a peer group matched to your size and service model rather than a generic industry figure.