
The employee Net Promoter Score, or eNPS, measures exactly that: how likely employees are to recommend their workplace to a colleague. This article covers the scale, the formula, how to interpret results, survey design, and how to use the score without over-relying on it.
One caution up front: eNPS is a useful starting signal. It is not a complete measure of engagement, satisfaction, retention, or care quality on its own.
Key Takeaways
- eNPS asks one 0-10 recommendation question and sorts employees into promoters, passives, and detractors
- Score = % promoters − % detractors; passives are excluded from the math
- A "good" score is relative to your industry, workforce, and baseline—not a fixed cutoff
- Open comments and segmented results turn the score into a concrete action plan
- Behavioral health teams get more value pairing eNPS with burnout, onboarding, and retention metrics
What Is eNPS?
eNPS stands for employee Net Promoter Score. It measures how willing your employees are to recommend your organization as a place to work, using one core question: "How likely are you to recommend this organization as a place to work?"
The concept borrows from customer Net Promoter Score (NPS), a metric Bain & Company popularized to gauge whether customers would recommend a product or service. eNPS applies the same idea to the workplace, asking employees—not customers—whether they would recommend the organization.
Respondents answer on a 0-10 scale and fall into three groups:
- Promoters (9-10): Highly satisfied employees who actively advocate for the organization
- Passives (7-8): Reasonably content staff who aren't likely to speak up either way
- Detractors (0-6): Employees signaling dissatisfaction or unresolved concerns
What eNPS Can and Can't Tell You
eNPS is a high-level sentiment signal. It tells you that something has shifted, not why. A dip in the score might point to a scheduling change, a new manager, or a stressful month, but you need follow-up questions to find out which.
For behavioral health organizations, this matters because staff satisfaction, team stability, and burnout risk directly shape the employee experience across clinical and support roles. That said, eNPS alone shouldn't be treated as a proxy for patient outcomes. It measures workforce sentiment, not care quality.
Why eNPS Matters for Behavioral Health Organizations
Behavioral health work is emotionally demanding by design. Clinicians and support staff absorb client crises, carry heavy caseloads, and often work in under-resourced teams. Employee advocacy, or the lack of it, tends to surface before people walk out the door.
A 2023 survey of 750 U.S. behavioral health workers found that 93% had experienced burnout and 62% reported moderate or severe burnout, according to the National Council for Mental Wellbeing and The Harris Poll. Another 48% were weighing other job options. Those numbers describe a workforce already close to the edge.

eNPS can help leaders catch sentiment shifts before they show up as:
- Resignations
- Rising vacancy rates
- Spiking absenteeism
- Exit interview complaints
A declining score should prompt specific questions:
- Are managers providing enough support?
- Is workload sustainable?
- Do staff feel psychologically safe raising concerns?
- Is recognition happening, or is it an afterthought?
Segment Before You Conclude Anything
An organization-wide average can hide a lot. A facility-wide eNPS of +40 might mask a night-shift team sitting at -10.
Where privacy and sample size allow, segment results by:
- Role
- Team
- Tenure
- Location
- Manager
Care Predictor's platform lets organizations slice eNPS by team, manager, or location instead of one blended number. That granularity is where useful insight lives: spotting workforce strain early, before it becomes an open position.
How Is eNPS Calculated and Interpreted?
The formula is simple:
eNPS = % of Promoters − % of Detractors
Step-by-Step Calculation
- Collect responses on the 0-10 recommendation question
- Classify each response into promoter (9-10), passive (7-8), or detractor (0-6)
- Calculate the percentage each group represents of total respondents
- Subtract the detractor percentage from the promoter percentage

Example: Say 100 employees respond. 68 are promoters, 22 are passives, and 10 are detractors. The math: 68% − 10% = +62 eNPS.
That figure mirrors a real dashboard example from Care Predictor's engagement platform. The same score sat 18 points above the prior quarter, against an industry average of +12.
Notice that passives (the 22%) count toward the total respondent pool but never enter the subtraction itself.
Reading the Range
Scores run from -100 to +100:
- Positive score: More promoters than detractors
- Zero: Promoters and detractors are evenly matched
- Negative score: Detractors outnumber promoters
No single threshold applies equally to every organization, so resist the urge to treat +20 as automatically "good" or -5 as automatically "bad" without context.
Don't Confuse an Average Rating With eNPS
Some platforms report an average satisfaction score — for instance, Care Predictor's separate Care Predictor Score rates overall assessment results on a 0-100 scale, with bands like "Excellent" or "Growth Opportunity." That's a useful metric, but it's not eNPS.
Averaging all 0-10 responses together is a different calculation entirely and will produce a different number with a different meaning. Stick to the promoter-minus-detractor formula when you're reporting eNPS specifically.
When interpreting results, look beyond the single number. Review:
- Response rate and total respondent count
- Score distribution and written comments
- Team-level differences across the organization
- Movement across multiple survey cycles
What Is a Good eNPS Score?
No universal threshold defines a good eNPS, but published benchmarks offer useful reference points.
Culture Amp's July 2026 data puts the median eNPS for healthcare organizations at 17, and specifically 22 for hospital and health care organizations, based on roughly 150-250 organizations surveyed globally (per Culture Amp's healthcare benchmark report).
These figures are directional, not prescriptive. A few reasons why:
- Different vendors use different samples. Benchmarks aren't interchangeable across survey providers or industry definitions.
- No behavioral-health-specific benchmark currently exists in the sources reviewed for this article.
- A score above zero means more promoters than detractors, not that every team is thriving.
- A high score can still hide problems among passives or small departments that get averaged out.
- A low score might reflect a one-time event, like a leadership change, rather than a chronic issue.
Compare Like With Like
Internal trend data usually beats external comparison. Track your own score over time, using consistent question wording, scale, timing, anonymity practices, and audience. A +15 this quarter versus +5 last quarter tells you more than comparing your organization to a hospital system using a completely different survey method.
How to Use eNPS Surveys Effectively
Keep the Survey Short
Start with the standard 0-10 recommendation question, then add one or two open-ended prompts:
- "What is the main reason for your score?"
- "What is one change that would improve your experience?"
Protect Response Quality
- Keep responses anonymous or confidential
- Use neutral, non-leading wording
- Make distribution accessible across all shifts and roles
- Tell employees upfront how the data will be used
- Avoid identifiable reporting for very small groups
- Make clear that responses will not affect employment decisions
Set a Sustainable Cadence
Bain reports that organizations using its employee NPS approach most often collect feedback monthly. Qualtrics notes that monthly or quarterly pulse surveys are common, and frequency should track how quickly teams can act on findings.
Survey fatigue is a real risk if cadence outpaces follow-through. Match frequency to your capacity to respond.
Build an Action Loop
- Survey employees and calculate the score
- Segment and analyze results alongside comments and workforce indicators
- Share findings honestly — including what leaders heard and what can't change yet
- Assign owners and timelines to a small number of specific actions
- Recheck sentiment in a later survey or pulse check

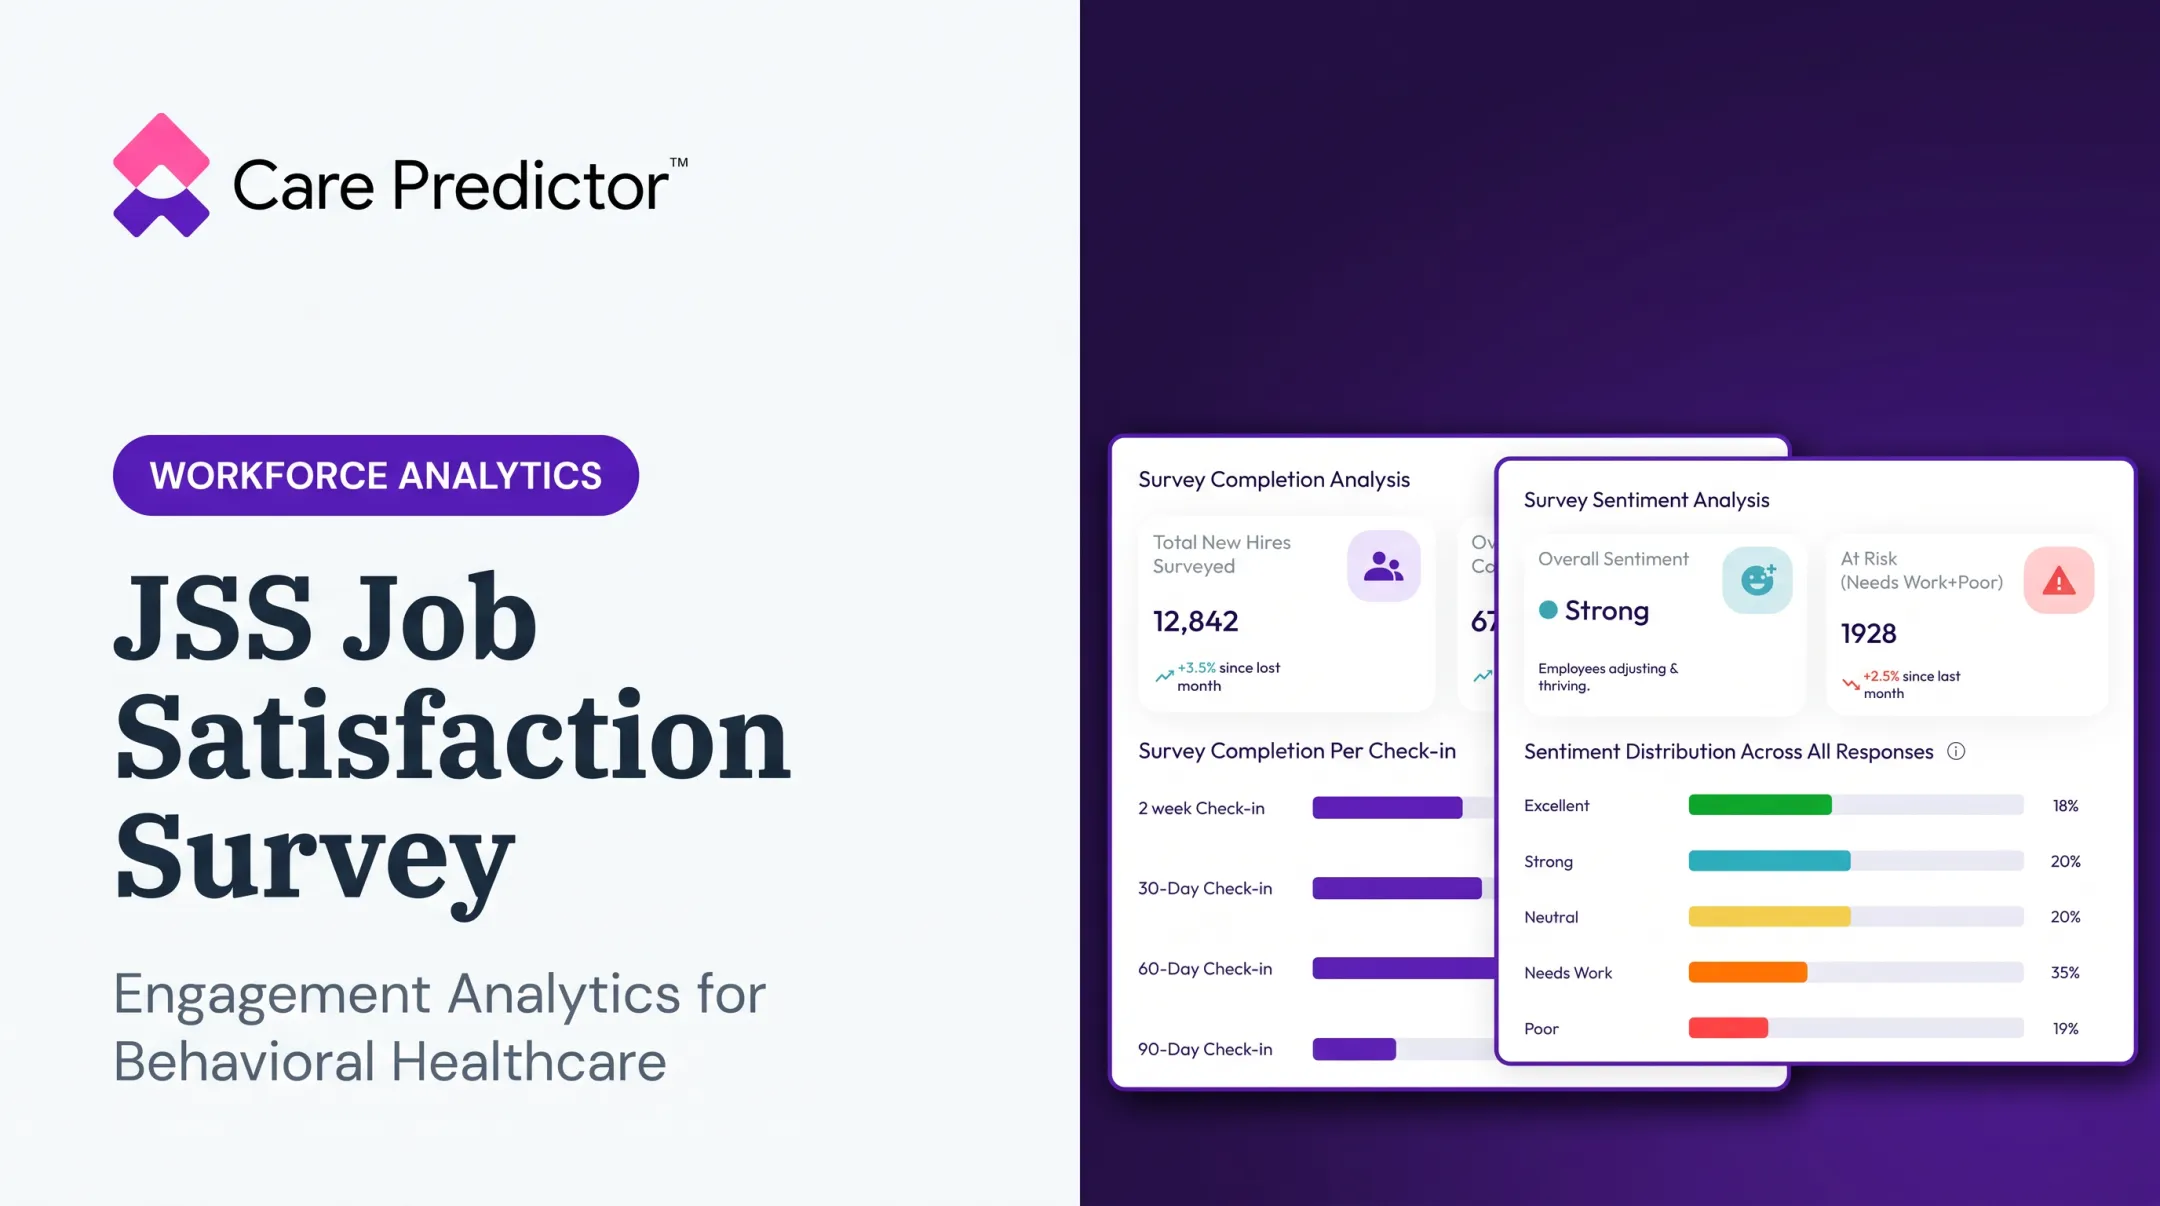
This is where a platform built for behavioral health workflows can help. Care Predictor's Employee Feedback & Engagement Survey Platform pairs eNPS tracking with pulse check-ins at 30, 60, and 90 days post-hire. AI analysis of open-ended comments flags sentiment trends and at-risk staff.
It will not do the follow-through for you, but it makes the next step easier to act on. To connect eNPS results to hiring, onboarding, and retention decisions, book a call to see how the pieces fit together.
Limitations of eNPS and What to Measure Alongside It
eNPS gives you a directional score, not the reasons behind it. Pair it with qualitative comments, pulse surveys, interviews, or focus groups to understand what's actually driving the number.
Blind spots to watch for:
- Passives aren't truly neutral. They sit outside the formula, yet they may feel uncertain, overlooked, or one rough month away from becoming detractors.
- Low response rates can distort results. AAPOR notes that nonresponse bias depends on how respondents differ from nonrespondents, not the rate alone. Still track participation each cycle.
- Fear of retaliation suppresses honesty. A SHRM-cited 2022 survey of 1,000 U.S. employees found that mistrust leads to less candid survey responses.
- Inconsistent timing and administration skew comparisons across survey cycles.
Treat eNPS as one input, not the whole dashboard. Pair the score with:
- Retention rates and internal mobility
- Absenteeism and vacancy duration
- Onboarding experience and manager effectiveness
Culture Amp's methodology notes that multi-item engagement measures tend to correlate more reliably with turnover than a single eNPS question alone.
Frequently Asked Questions
What is eNPS (employee Net Promoter Score)?
eNPS measures how likely employees are to recommend their workplace to a friend or colleague. It's a high-level indicator of sentiment, not a full measure of engagement or satisfaction.
How is eNPS calculated?
eNPS equals the percentage of promoters (9-10) minus the percentage of detractors (0-6). Passives (7-8) are excluded from the formula.
What is a good eNPS score?
Benchmarks vary by industry, vendor, and survey methodology, so there's no universal cutoff. Internal improvement over time usually matters more than matching an unrelated organization's score.
What is an eNPS survey used for?
Organizations use eNPS to track employee advocacy over time and spot where deeper investigation or workplace changes may be needed. It works best as a starting point for follow-up, not a final answer.
What questions should you ask in an eNPS survey?
Start with the standard 0-10 recommendation question, then add an open-ended "What's the main reason for your score?" prompt and one action-oriented question about what would improve the experience.
Should eNPS use a 0-10 or 1-10 scale?
Stick with the standard 0-10 scale. It preserves comparability with established eNPS methodology. Changing the scale shifts how responses get categorized and makes benchmark comparisons unreliable.