
A 2023 Harris Poll survey of 750 U.S. mental health and substance use disorder workers found that 62% reported moderate or severe burnout, and 48% said workforce shortages had made them consider other employment.
Predictive analytics offers a way to see these pressures building before someone hands in notice. It uses historical and current workforce data to flag conditions associated with voluntary attrition. That's a signal, not a sentence — the data should inform a manager's conversation, never replace their judgment.
This article lays out a practical framework: define what you're predicting, choose signals that are ethical and useful, connect insights to real support, and measure whether your actions actually improve stability.
Key Takeaways
- Predictive analytics flags workplace strain early enough to intervene.
- Prioritize workload, supervision, onboarding, and development over a single risk score.
- Models need transparency, bias testing, and human review; never auto-trigger discipline or termination.
- Every risk driver needs an owner, a supportive action, and a follow-up measurement.
What Predictive Analytics for Employee Retention Means — And Why It Matters
Three Levels of Workforce Analytics
Most HR data work falls into one of three categories:
- Descriptive — What already happened (departures by site last quarter)
- Diagnostic — Why it happened (exit interviews, pattern review)
- Predictive — What's likely to happen next (emerging risk in specific cohorts)
A 2021 WorldatWork survey found that among organizations working on attrition and retention, 48% used descriptive methods, 29% diagnostic, and just 17% predictive. Predictive work is still the exception in HR analytics, so a careful rollout beats a rushed one.
Predictive analytics for retention means using historical workforce data, statistics, and machine learning to estimate how likely an outcome is within a defined window, such as voluntary attrition among residential counselors over the next 90 days. The target has to be specific. "Turnover" is vague. "Regrettable attrition among direct-care staff within one year" is something you can actually test and act on.
Correlation isn't causation. A model might flag that staff with fewer supervision touchpoints leave more often. That doesn't mean thin supervision causes departures by itself. It means a leader should investigate context like caseload or scheduling before deciding what to change.
Why This Hits Harder in Behavioral Health
Turnover here touches more than payroll:
- Recruitment and onboarding teams stretch thin refilling the same roles
- Remaining staff absorb caseloads, which can deepen burnout
- Patients lose continuity with a therapist or care team mid-treatment
- Institutional knowledge about program-specific protocols disappears with each exit
Reactive tools like exit interviews and counteroffers still matter, but they work after someone has already decided to leave. Predictive analytics lets leaders examine patterns across teams, shifts, and tenure groups instead of individuals. That shifts the question from "who's a flight risk" to "what conditions are pushing people out."
This is the foundation of Care Predictor's approach: combining behavioral science and data analytics to help behavioral health organizations hire, engage, and retain staff who deliver better care.
Predictive insight doesn't guarantee anyone stays, and it should never be the sole basis for pay, scheduling, discipline, or termination decisions. Treat it as a prompt for a human conversation, not a verdict.
What Data Can Help Predict Employee Attrition?
Good predictive work starts with the right inputs. Organize them into four categories, and give every field a clear reason to exist.
Workforce and employment data
- Role, tenure, internal moves, and promotion history
- Manager changes and employment status
- Onboarding milestones and training completion
Tracking manager changes makes sense if you are testing whether leadership instability correlates with departures. Collecting fields "just in case" invites misuse.
Employee experience data
- Engagement surveys and pulse checks
- Stay interviews and manager feedback
- Onboarding surveys and recognition measures
- Anonymized open-ended comments
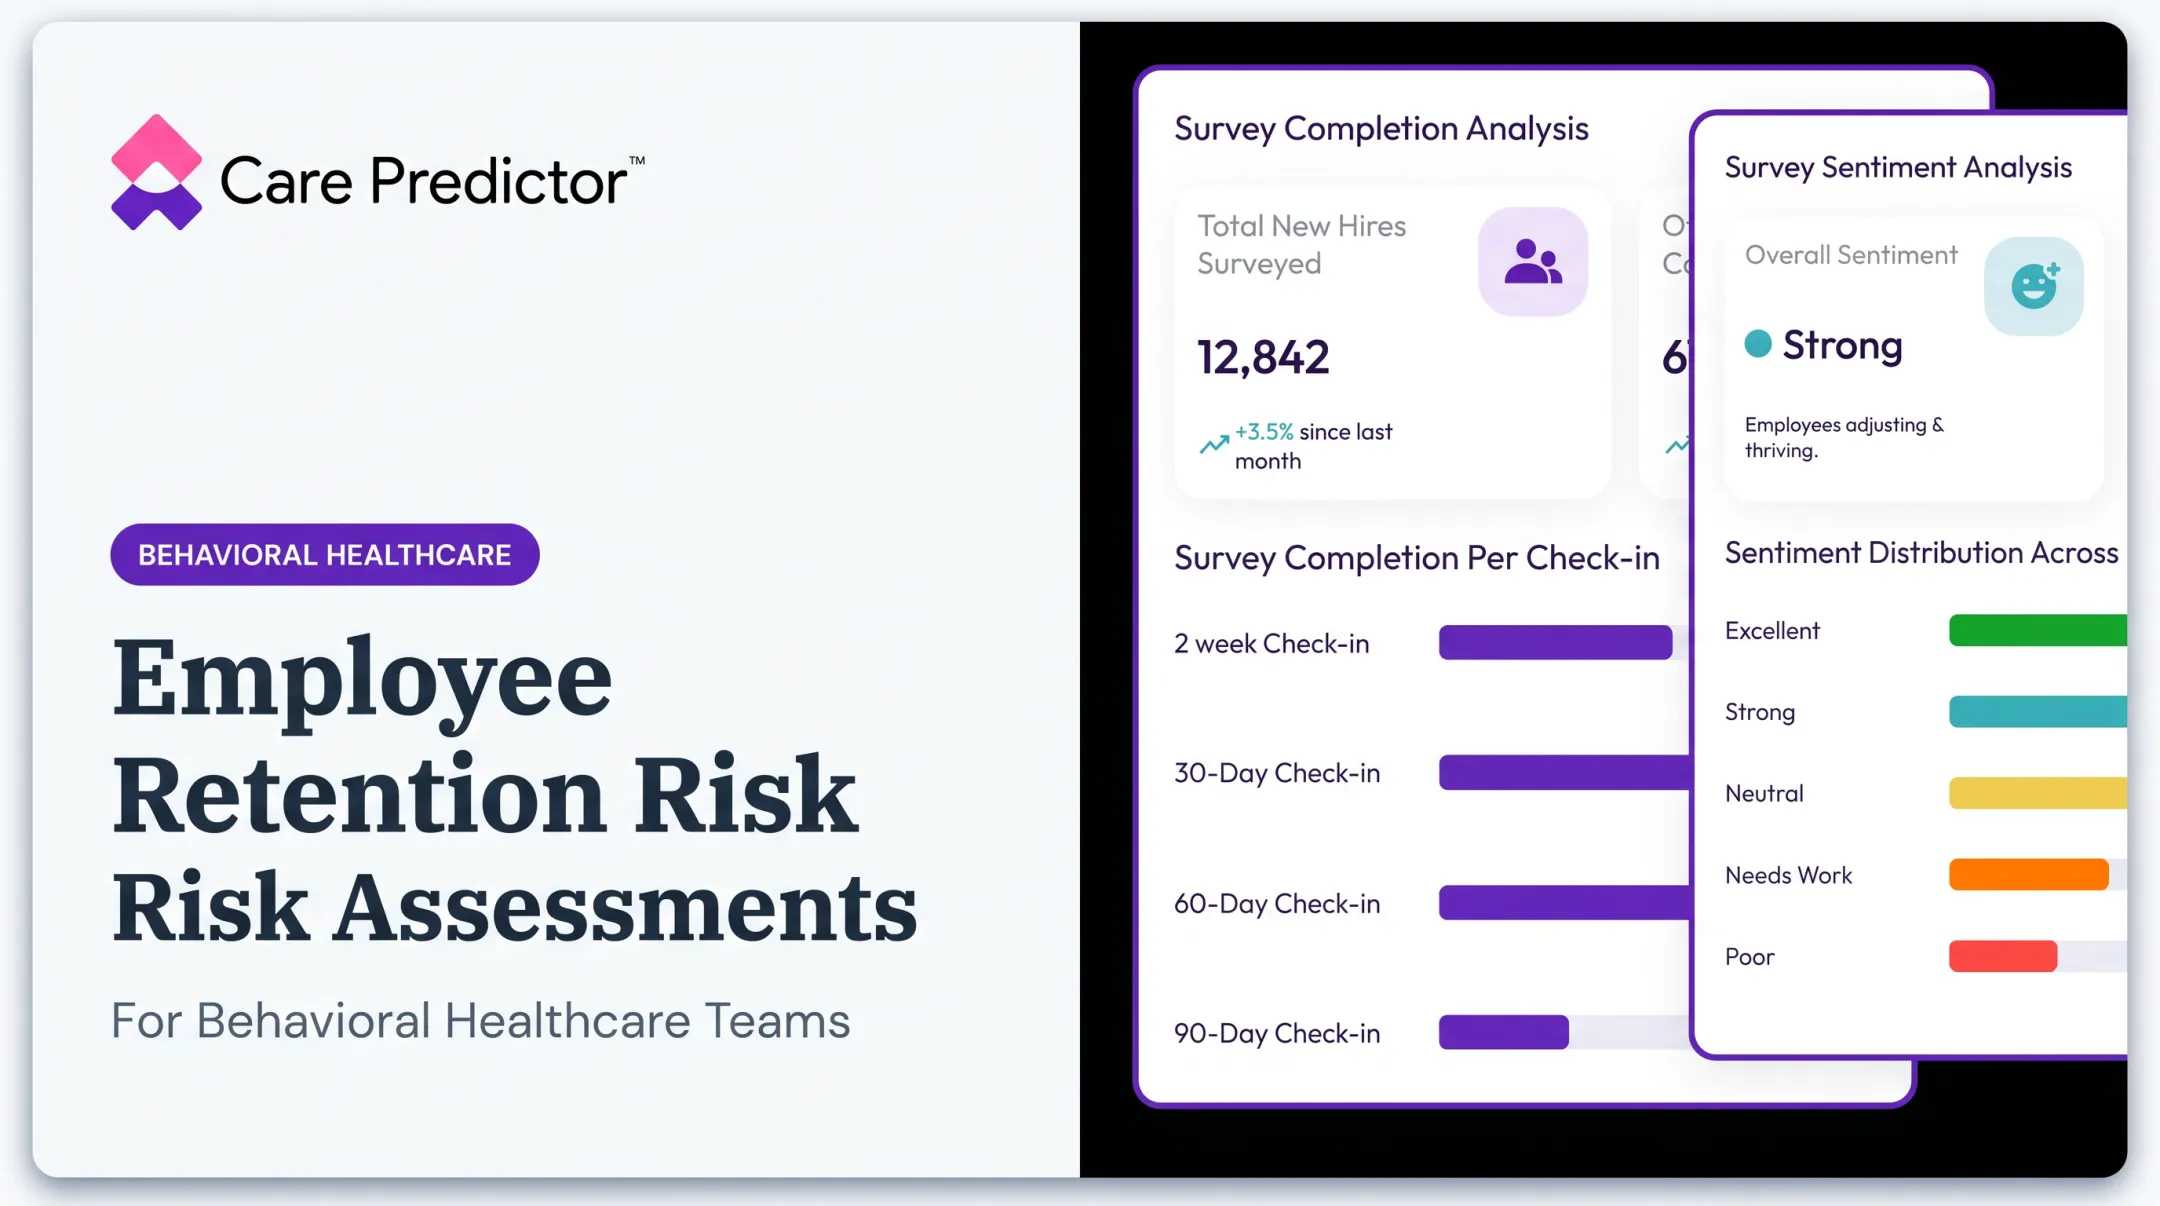
Care Predictor's platform, for example, runs new-hire pulse checks at 2-week, 30-day, 60-day, and 90-day intervals, plus ongoing engagement and eNPS tracking. Leaders get a continuous read on sentiment instead of a once-a-year snapshot.
Work-condition data
- Caseload, shift patterns, and schedule predictability
- Overtime and absence trends
- Supervision frequency and team vacancies
- Role changes, workload spikes, and signs of compassion fatigue
Skip invasive content monitoring here. The goal is workload and scheduling visibility, not surveillance of private communications.
Historical outcome data
- Past turnover and cohort retention rates
- Documented exit reasons and resignation timing
- Prior intervention outcomes where available
These lagging indicators anchor the model in what actually happened. They balance leading signals that can shift before anyone resigns.
Same Signal, Different Causes
Signals still need context. A spike in unplanned absences on one team might point to burnout. On another, it may reflect one employee's caregiving situation or a scheduling conflict after a shift change.
Treating every instance the same way, such as a generic wellness email, misses the real fix. Protect interpretation with consistent definitions, complete records, reliable timestamps, and documented sources. Check regularly for gaps or bias before anyone acts on the output.
How to Build a Predictive Employee Retention Program
A retention program works when scope is tight and action is assigned. These six steps move a team from a vague request for "a model" to signals leaders can review without overexposing individual employee data.
- Ask a focused question — "Which teams show rising voluntary attrition risk?" not "build us a retention model."
- Define the outcome, population, and window — Decide whether you're tracking voluntary versus involuntary turnover, regrettable versus non-regrettable departures, and a 30-, 60-, or 90-day forecast.
- Start at the team or cohort level — Aggregated analysis lets leaders address systemic issues without unnecessarily exposing individual employee data.
- Choose an interpretable model — A model that outputs "workload and recognition are the top two drivers for this cohort" beats an unexplained score every time.
- Validate across groups and time — Confirm predictions hold up across job families, tenure bands, shifts, and locations, not just in aggregate.
- Build the workflow — Decide who reviews signals, who investigates context, who talks with employees, who approves action, and how follow-up gets documented.

In practice, this shows up as a quarterly dashboard. A 145-employee organization might track:
- 5% turnover rate
- 7 exits in the period
- Roughly 10 months average tenure
Break those results down by quarter, type, and department. That view shows where risk concentrates before it spreads across the whole team.
The same lifecycle logic powers Care Predictor's Talent Success Platform across ASSESS, INTERVIEW, and PREDICT. Care Profile reports and workforce surveys help organizations support staff before the hire, through onboarding, and across employment. The platform does not claim a guaranteed retention outcome.
Turning Attrition Predictions Into Retention Action
A prediction has no value until someone acts on it: respectfully, specifically, and on time.
| Risk Driver | Likely Intervention |
|---|---|
| Workload or caseload pressure | Staffing and workload review |
| Supervision concerns | Manager coaching |
| Limited growth | Development planning |
| Weak onboarding | Structured check-ins |
| Recognition gaps | Consistent recognition practices |
| Scheduling strain | Schedule review |
Stay interviews and manager-led conversations help validate what the data suggests. Managers should never reveal a sensitive risk score or frame the conversation as an accusation. The goal is "how's the caseload feeling lately," not "our system flagged you."
Build an Intervention Playbook
Each driver needs:
- A trigger: the data condition that activates the action
- A responsible owner
- Approved action options
- Employee input
- A follow-up date and success measure
Prioritize by urgency, business impact, feasibility, and whether the issue touches one person or an entire team.
Example: A residential team shows rising workload and declining engagement scores. The response: validate the pattern against vacancy data, review scheduling, talk with staff directly, adjust hours or staffing, then monitor both engagement movement and actual exits over the following quarter.

Retention actions should improve working conditions broadly, not lean solely on bonuses or persuade people to stay in structurally unsustainable roles. Care Predictor's manager-effectiveness surveys and pulse-survey insights support this work by helping organizations develop managers and hold them accountable for follow-through, not just data collection.
Metrics to Measure Retention and Program Effectiveness
Core retention metrics:
- Overall retention rate — employees present throughout the period divided by employees present at its start
- Voluntary and regrettable attrition
- Early-tenure turnover, tracked separately at 90 days and one year
- Role- and team-level turnover
- Time to productivity
Leading indicators:
- Engagement movement and manager effectiveness
- Supervision participation and workload measures
- Onboarding completion and absence patterns
- Intervention completion rates
Compare these across cohorts, not a single company-wide average. A 15% blended turnover figure can hide a 40% turnover unit sitting next to a near-zero one.
Close the loop in order: detect risk, identify drivers, complete an intervention, reassess the leading indicator, then check whether actual retention improved.
Gallup's Q12 meta-analysis found 21% lower turnover in highly engaged versus less engaged units within high-turnover organizations, and 51% lower turnover within low-turnover organizations. Engagement gains tend to track with retention differences, even without proof that one specific intervention caused the change.
Care Predictor's reporting dashboard pairs the same views for operators. One configuration ties a 16% turnover rate to an 87% treatment completion rate, so leaders can read workforce and clinical outcomes side by side.
Internal data has also linked clinician Care Profile scores of 80-plus to 25% more completed treatments and 29% fewer AMA discharges. Staff quality and outcome quality move together; that is correlation evidence, not proof that one score predicts everything.

Responsible, Ethical, and Secure Use of Predictive Analytics
Attrition predictions involve sensitive workforce information. That requires a documented purpose for every data category collected, role-based access, defined retention limits, and secure handling throughout.
Fairness risks are real. Biased historical decisions, proxy variables, uneven data quality across groups, and false positives can lead some employees to be treated differently than others. Regular testing should check for:
- Disparate error rates across job families or tenure groups
- Model drift over time
- Unexplained shifts in predictions
- Performance differences across shifts and locations
Transparency matters as much as accuracy. Employees and managers should know the program's purpose is support, what data feeds it, who can see outputs, and what the model cannot decide.
Human review belongs between every prediction and any employment action. A risk score should never serve as the automatic basis for discipline, reduced opportunity, or termination.
Guidance from the EEOC has flagged how automated tools can screen out qualified workers, including those with disabilities. NIST's AI Risk Management Framework (voluntary, but widely referenced) organizes responsible AI practice around four functions: Govern, Map, Measure, and Manage. Neither substitutes for legal counsel reviewing your specific tool and use case.

On the security side, Care Predictor maintains ISO 27001:2022 certification, SOC 2 and PCI-DSS 4.0 alignment, and NIST Cybersecurity Framework-based practices, including role-based access controls and a strict no-BYOD policy. These are the company's stated credentials, not a replacement for an organization's own compliance review.
Conclusion: Use Predictive Analytics to Strengthen the Employee Experience
Predictive analytics earns its place in behavioral health workforce planning when it helps leaders spot preventable attrition risks and respond with empathy, evidence, and accountability.
The practical sequence holds up regardless of organization size:
- Define the attrition outcome you're tracking
- Gather relevant, ethical data
- Validate what the model tells you
- Involve managers and employees directly
- Connect every driver to a specific action
- Measure whether that action actually worked
Better hires, better engagement, and better outcomes start with the people delivering care—that premise is why Care Predictor exists. If your organization wants behavioral-health-specific workforce intelligence to support team stability, talk with Care Predictor about what that looks like in practice.
Frequently Asked Questions
How can I predict employee attrition?
Define a specific attrition outcome, then combine historical turnover data with engagement, workload, manager, and onboarding signals. Validate a transparent model and use human-reviewed insights to guide supportive conversations, not automatic decisions.
What are some metrics that measure employee retention?
Core measures include overall retention rate, voluntary and regrettable attrition, early-tenure turnover, and turnover by role or team. Tenure distribution, engagement trends, and intervention follow-through add fuller context.
What are the 5 key HR metrics?
A practical shortlist includes turnover or attrition, retention, time to fill, absenteeism, and engagement. The right mix still depends on your organization's goals and workforce context.
What are the 5 C's of employee engagement?
One widely cited framework defines the five Cs as communication, connection, culture, contribution, and career development. Other sources use different terms, so check which version a given source is referencing.
What is a KPI for employee engagement?
An engagement KPI should track a defined outcome over time. Common options include engagement score movement, survey participation rate, favorable responses to key experience questions, and the link between engagement and retention.